

Estimated adjusted changes in blood lead level quantiles from multivariable linear quantile mixed regression models. Each panel shows the adjusted beta coefficient for each characteristic at different quantiles of BLL and their corresponding 95% confidence intervals from the linear quantile mixed model, adjusted for individual, household, and environmental characteristics. The adjusted beta coefficient is interpreted as the change in BLL at a specific quantile due to a given characteristic. FIS indicates food insecurity; HH, household; F = female; M = male.

Cardiovascular Disease (CVD) Prevalence by Depressive Symptoms (DS) level and sex in HCVD Cohort, March 2019–August 2021.

Stages of the care continuum.
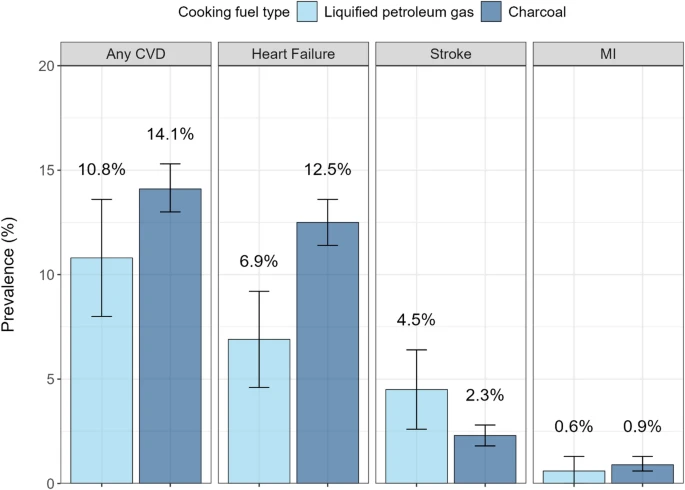
Prevalence of Cardiovascular Disease by Fuel Type. Bars represent 95% confidence intervals for prevalence.

Figure 1. Systolic blood pressure trajectory groups with 95% CIs.

Prevalence of comorbid CVD–MH illness in the Haiti Cardiovascular Disease Cohort. CVD indicates cardiovascular disease; and MH, mental health.

BP trajectories identified with group‐based multitrajectory modeling. Four BP trajectories were classified using systolic and diastolic BP: (1) low‐normal (mean BP, 99/66 mm Hg); (2) normal (mean BP, 112/71 mm Hg); (3) elevated (mean BP, 128/82 mm Hg); (4) high (mean BP, 141/85 mm Hg).

Fig. 1. Phenotypes of national obesity trajectories in children and adolescents.

Diagnostic measures comparing MetS models to reference overall and by sex.

Heat map of blood pressure control across clinic and community study visits over 24 months (N = 568). Red bars indicate uncontrolled BP, green bars controlled BP, and gray bars missing visits.

Average Systolic and Diastolic BP by Age, Stratified by Sex.

Kaplan Meier survival curve for retention 12 months from enrollment, stratified by randomization arm.

Health‐related quality of life measured by SF‐12 component scores by CVD multimorbidity groups.
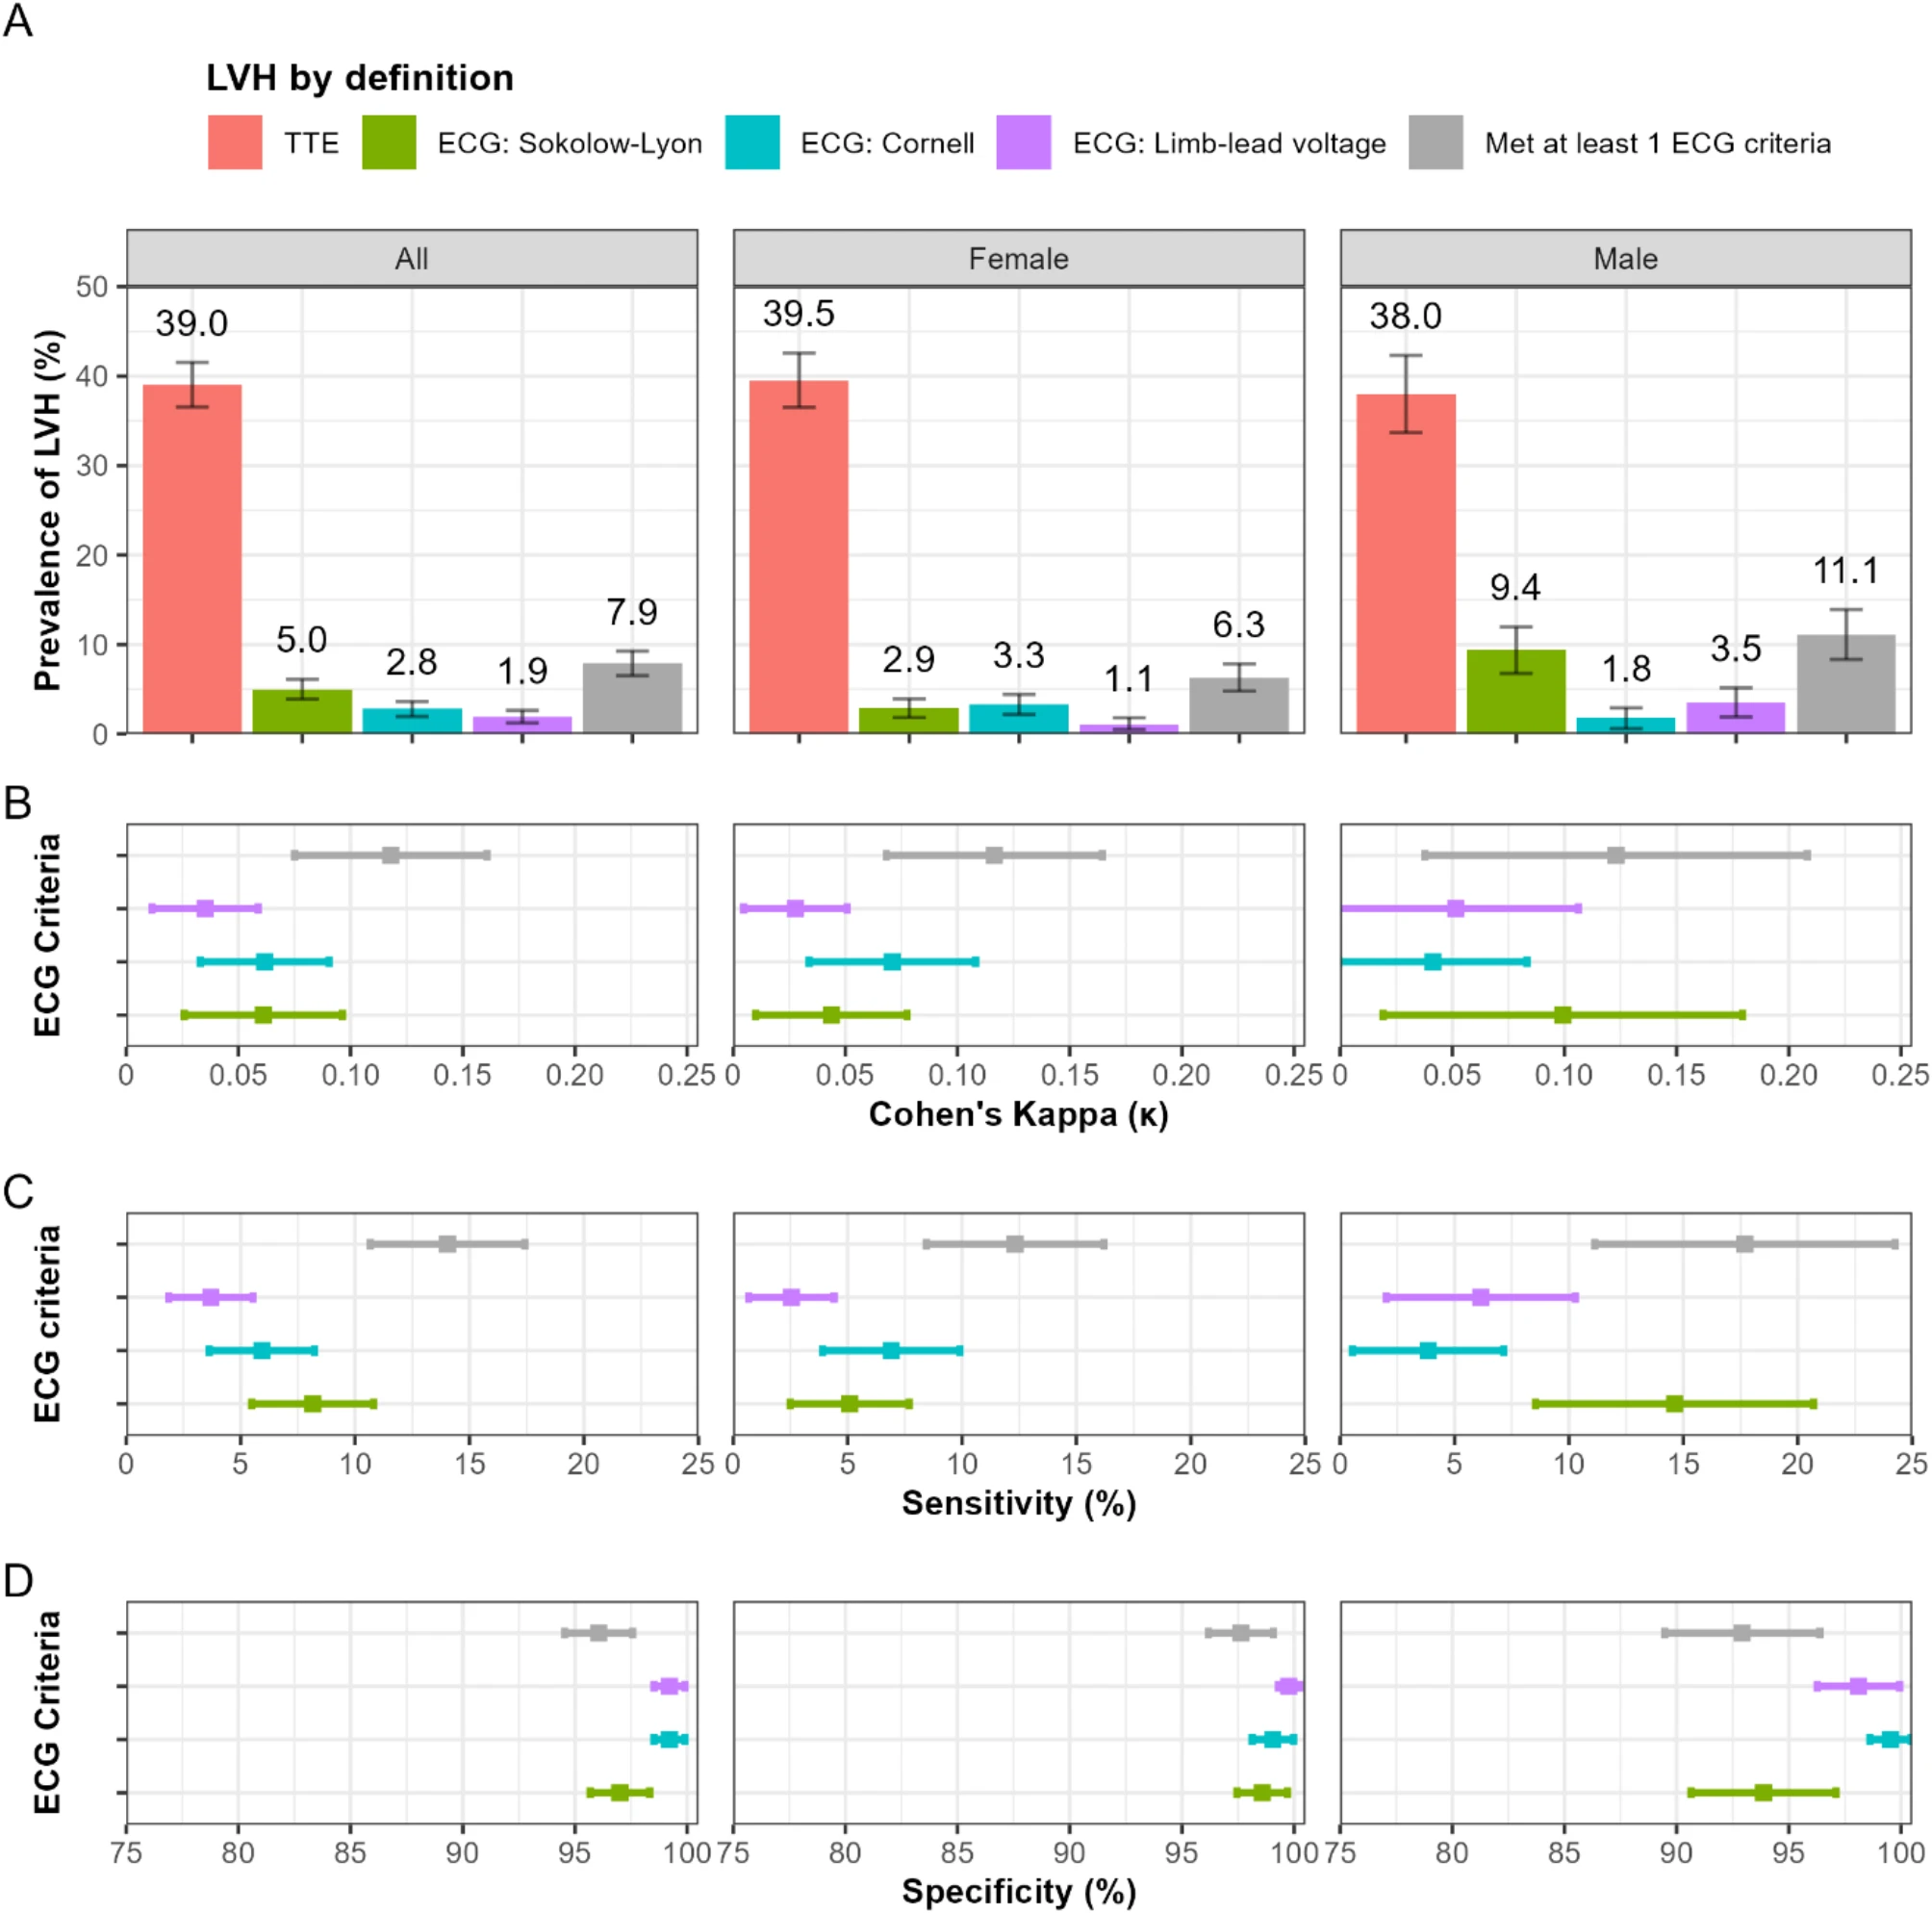
(A) Prevalence of left ventricular hypertrophy (LVH) based on five diagnostic methods. (B) Cohen's kappa statistic, (C) sensitivity and (D) specificity of each ECG criteria compared with reference standard transthoracic echocardiography for diagnosing LVH. Error bars represent the 95% confidence interval.

Type of cooking fuel. Dark gray and light blue bars represent polluting and clean fuel, respectively.

Adverse Pregnancy Outcomes: Individual burden and co-occurrence of key adverse pregnancy outcomes. (A) Counts of women with one or more reported adverse pregnancy outcomes. (B) Visual summary of co-occurrence of adverse pregnancy outcomes (n=623).

Mapping themes to consolidated framework of implementation research.

Incident hypertension defined as two follow-up visits with BP ≥140/90 mmHg or one follow-up visit with BP ≥160/100 mmHg.
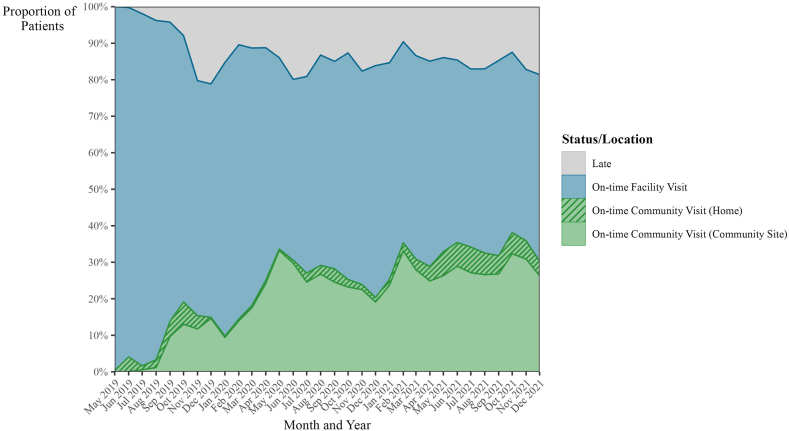
Proportion of on-time visits by month and location. Shading for each month represents the proportion of monthly HIV visits completed on-time (within 30 days of the scheduled date), and where the on-time visits took place.

SBP change in intervention vs control groups.

Prevalence of Hypertension, Total Cardiovascular Disease (CVD), and Heart Failure in Social Vulnerability Index–Haiti (SVI-H) Quartile 4 vs SVI-H Quartile 1, Stratified by Age and Sex.

Age-adjusted prevalence of cardiovascular diseases in the Haiti cardiovascular disease cohort. 95% confidence intervals are represented using error bars. CVD, cardiovascular disease; HF, heart failure; TIA, transient ischemic attack; MI, myocardial infarction.

Sodium intake comparison between systolic blood pressure groups, stratified by age group.

Heart failure prevalence stratified by age and subtype (HFrEF, HFmrEF and HFpEF). Aggregate HF prevalence per age group represented by line.
An adapted self-screening tool for peripartum cardiomyopathy validated for use in Haiti, demonstrating high sensitivity for identifying at-risk women.

Prevalence by Kidney Disease Improving Global Outcomes CKD stage on the basis of eGFR and albumin-to-creatinine ratio values.
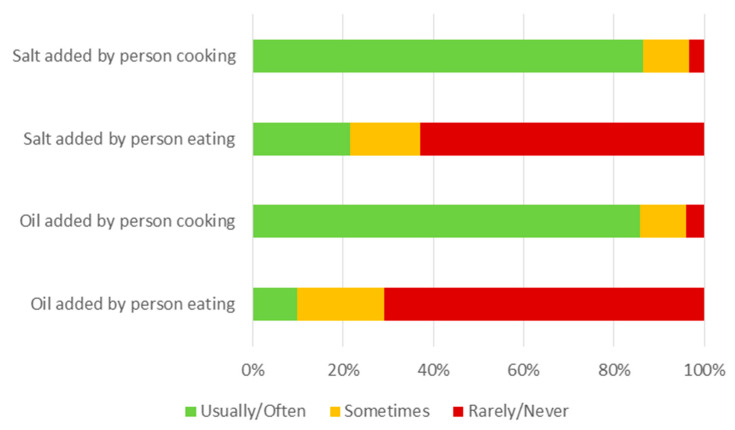
Frequency of adding salt and oil to food by participants and household cooks.
Distribution of BMI among male and female adults in the Haiti CVD Cohort (N = 2,966). Vertical lines represent cutoffs for WHO BMI categories at 18.5, 25, and 30 kg/m2.

Cumulative hypertension care continuum by sex. Percentage of female (N = 516) and male (N = 294) participants with hypertension who have been screened, diagnosed, treated, and controlled.
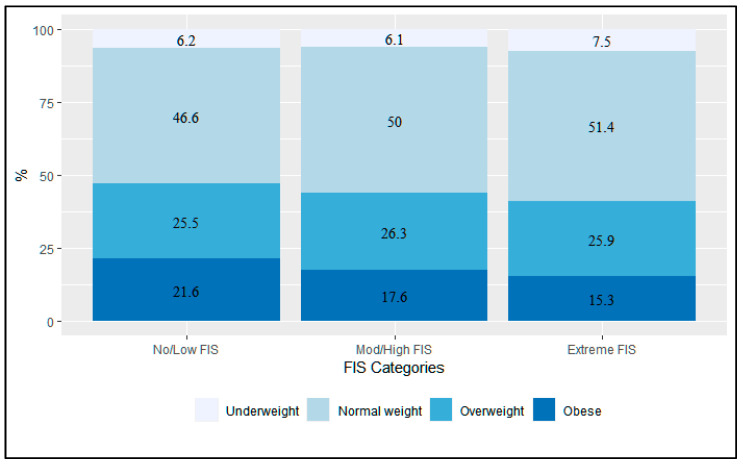
Prevalence of malnutrition by FIS from the Haiti CVD Cohort Study, 2019–2021 (N = 2972).

The line represents the linear regression between clinic and community BP.

Diabetes prevalence by sex and BMI. Bar height indicates estimated diabetes prevalence, with 95% CI indicated by whiskers. Left panel shows diabetes prevalence by sex, right panel shows diabetes prevalence by BMI category.

Trajectories of mean arterial blood pressure (N = 2306 pregnancies).

Predicted 10-year CVD risk categorizations by model. Figure shows proportion of cohort categorized as low, intermediate, or high-risk.
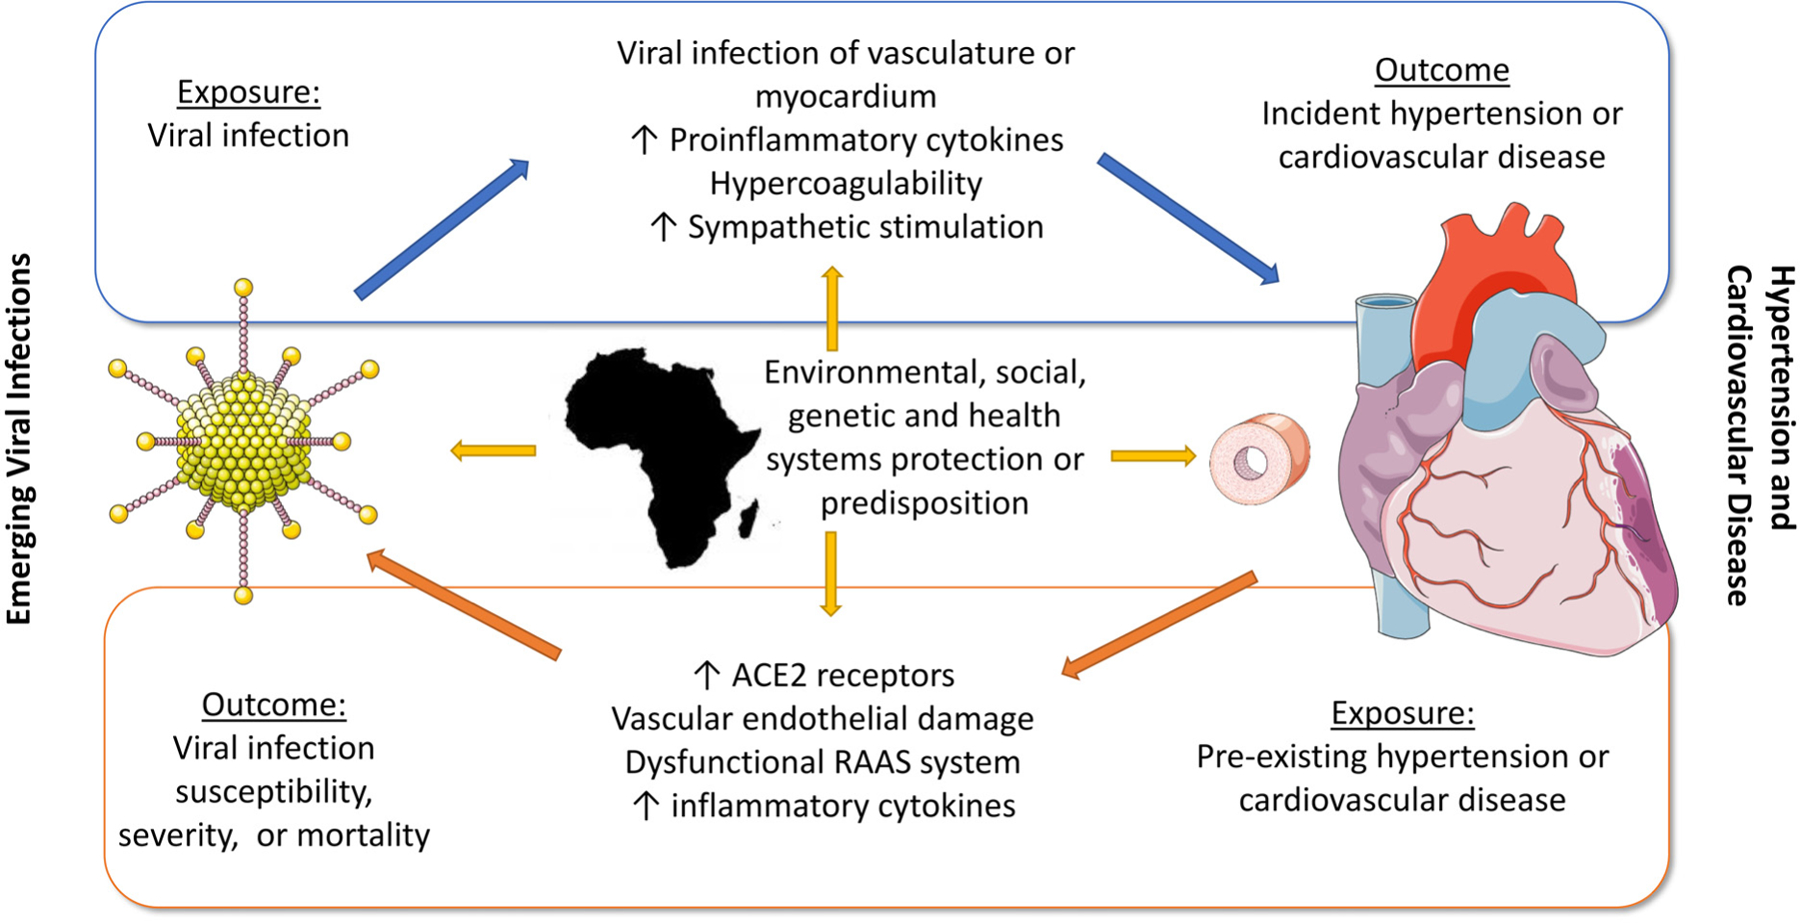
Interactions between emerging viral infections and CVD in sub-Saharan Africa.

Bar height is geometric mean blood lead levels in the total population, and stratified by males and females. USA data from NHANES 2009–2016 shown on the left; Haiti CVD Cohort data from 2021 shown on the right. Error bars represent 95% confidence intervals.

Distribution of neighborhood cohesion, neighborhood violence, perceived stress, depression, and hypertension. X axis represents scores or blood pressure categories; Y axis represents percent of participants with that score.

ASCVD polypill eligibility in Haiti using the Haiti CVD Cohort (N = 2,880 participants age ≥ 18 years). ASCVD, atherosclerotic cardiovascular disease; CI, confidence intervals; CVD, cardiovascular disease.

Study follow-up visits will occur in the GHESKIO Clinic, with community visits to measure BP offered in months 2, 5, and 8.

Adapted Social Ecological Model of CVD in Haiti.
Psychological distress among residents of four slum neighborhoods in Port-au-Prince, Haiti.
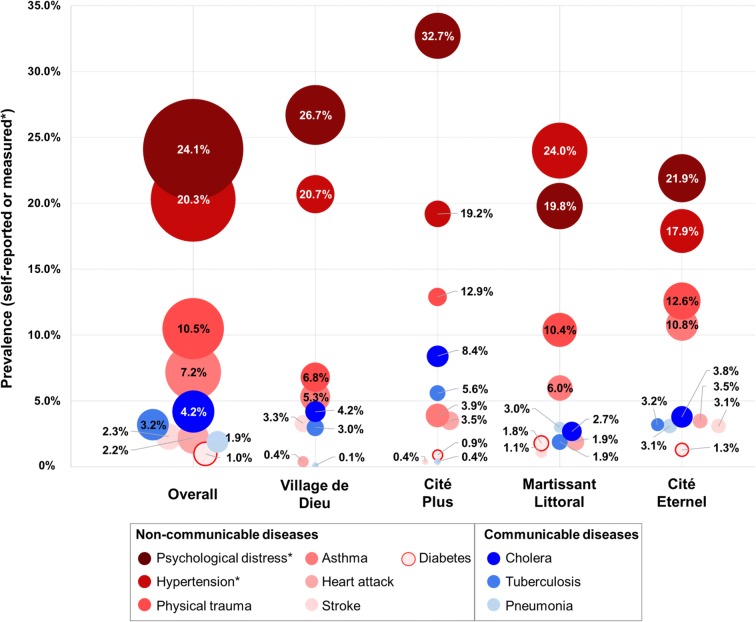
Prevalence of adult communicable and non-communicable diseases.

Patterns of co‐occurring CVDRFs among HIV‐infected adults >10 years after ART initiation. DM, diabetes mellitus; HC, hypercholesterolemia; HTN, hypertension; OB, obesity; SMO, smoking.
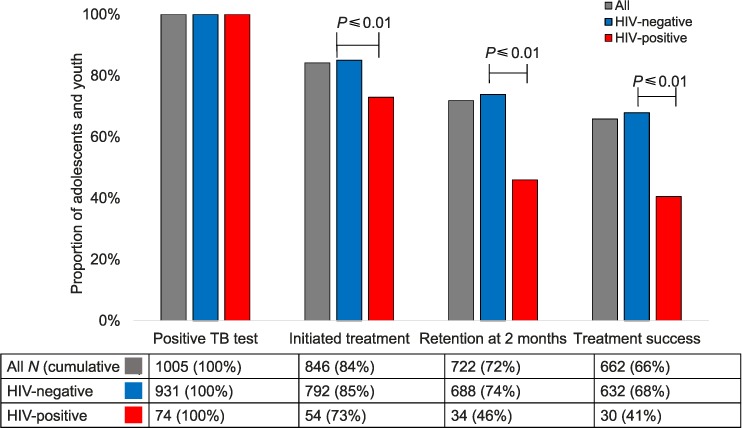
TB treatment continuum among adolescents and young adults aged 10–24 years with microbiologically confirmed TB in Haiti. TB = tuberculosis; HIV = human immunodeficiency virus.

Average blood pressure changes over 6 months; (top) systolic blood pressure; (bottom) diastolic blood pressure.